Aggregating Metrics in Spans
Logfire lets you aggregate counter and histogram metrics within the current active span and its ancestors. This is particularly useful for calculating totals for things like LLM token usage or costs on higher-level operations, making it easier and more efficient to query this data without processing individual child spans.
This guide will walk you through how to enable this feature and use it with both custom metrics and automated instrumentation.
Note
This is an experimental feature. The API and data format may change in future releases. We welcome your feedback to help us prioritize improvements and stability.
This only works for metrics recorded within the same process. It does not aggregate metrics across distributed traces.
Enabling Metric Aggregation
This feature is always enabled for any metric named operation.cost, which in particular is recorded by Pydantic AI (since v1.0.11) when instrumented for LLM costs.
To enable this feature for all metrics, you need to configure Logfire with the collect_in_spans option in MetricsOptions. This should be done once when your application starts.
import logfire

logfire.configure(metrics=logfire.MetricsOptions(collect_in_spans=True))
Once enabled, any counters or histograms recorded within a span will be aggregated into a logfire.metrics attribute on that span.
Example: A Custom Counter
Let's start with a simple example of tracking some cumulative amount.
First, we define a metric counter. Then, within a span, we add to it multiple times.
import logfire

logfire.configure(metrics=logfire.MetricsOptions(collect_in_spans=True))

counter = logfire.metric_counter('my_amount')

with logfire.span('doing stuff'):
    counter.add(1)
    counter.add(2)
The doing stuff span will now contain a logfire.metrics attribute that holds the aggregated total of the my_amount counter, i.e. 3.
Running the following query in the Explore view:
SELECT attributes->>'logfire.metrics'->>'my_amount'->>'total' AS total_amount
FROM records
WHERE span_name = 'doing stuff'
will return one row with total_amount equal to 3.
Example: LLM Token Usage and Costs with Pydantic AI
Generative AI instrumentations like Pydantic AI or OpenAI that follow OpenTelemetry conventions will record a metric called gen_ai.client.token.usage. You can use metric aggregation to get a total of tokens used in a higher-level operation that may involve multiple LLM calls. Pydantic AI specifically also records an operation.cost metric, which is always aggregated.
Here’s an example:
from pydantic_ai import Agent
import logfire

logfire.configure(metrics=logfire.MetricsOptions(collect_in_spans=True))
logfire.instrument_pydantic_ai()

agent = Agent('gpt-4o')

@agent.tool_plain
async def get_random_number() -> int:
    return 4

with logfire.span('span'):
    agent.run_sync('Give me one random number')
    agent.run_sync('Generate two random numbers')
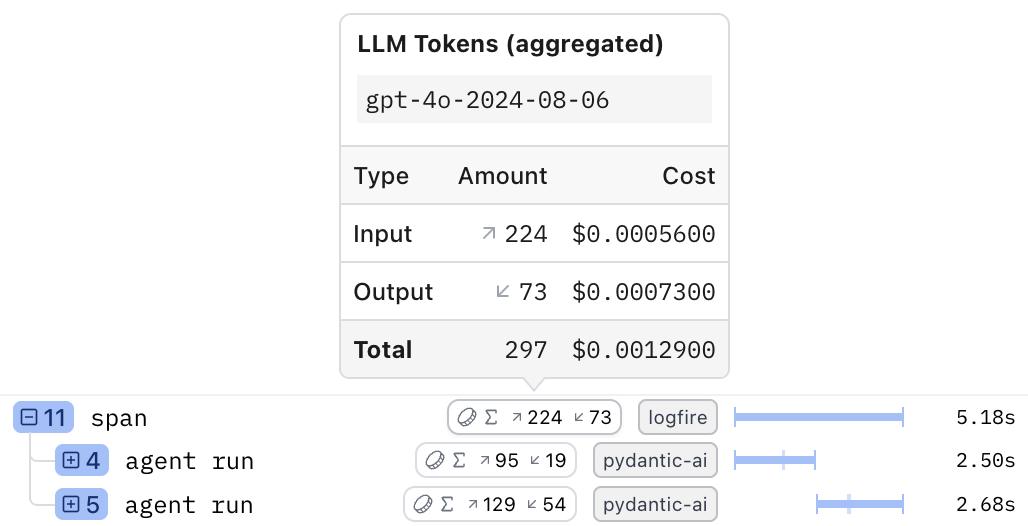
The calls to agent.run_sync create child spans named agent run. The outer span aggregates the token metrics from these children, as shown in the Live View:
Understanding the Span Data
The outer 'span' now has a logfire.metrics attribute containing the aggregated token data from the two agent.run_sync calls. The JSON structure looks like this:
{
  "gen_ai.client.token.usage": {
    "details": [
      {
        "attributes": {
          "gen_ai.operation.name": "chat",
          "gen_ai.request.model": "gpt-4o",
          "gen_ai.response.model": "gpt-4o-2024-08-06",
          "gen_ai.system": "openai",
          "gen_ai.token.type": "input"
        },
        "total": 224
      },
      {
        "attributes": {
          "gen_ai.operation.name": "chat",
          "gen_ai.request.model": "gpt-4o",
          "gen_ai.response.model": "gpt-4o-2024-08-06",
          "gen_ai.system": "openai",
          "gen_ai.token.type": "output"
        },
        "total": 73
      }
    ],
    "total": 297
  },
  "operation.cost": {
    "details": [
      {
        "attributes": {
          "gen_ai.operation.name": "chat",
          "gen_ai.request.model": "gpt-4o",
          "gen_ai.response.model": "gpt-4o-2024-08-06",
          "gen_ai.system": "openai",
          "gen_ai.token.type": "input"
        },
        "total": 0.00056
      },
      {
        "attributes": {
          "gen_ai.operation.name": "chat",
          "gen_ai.request.model": "gpt-4o",
          "gen_ai.response.model": "gpt-4o-2024-08-06",
          "gen_ai.system": "openai",
          "gen_ai.token.type": "output"
        },
        "total": 0.00073
      }
    ],
    "total": 0.00129
  }
}
Note:
- Each
totalvalue (both at the top level and insidedetails) in the JSON matches a value in the token badge in the UI. - Each of these metrics (but not metrics in general) has separate entries for
inputandoutputin thedetails, each with its own total. In general, each combination of values ofattributeshas its own entry indetails. Here, the only differing attribute isgen_ai.token.type.
The general structure of logfire.metrics is:
{
  "<metric_name>": {
    "details": [
      {
        "attributes": { ... },
        "total": <number>
      },
      ...
    ],
    "total": <number>
  },
  ...
}
Querying Nested Token Data
To query these nested details, you need a more complex SQL query to "un-nest" the JSON data into a flat, table-like structure.
WITH
    with_span_metric_name AS (SELECT unnest(json_keys(attributes->>'logfire.metrics')::text[]) AS span_metric_name, * FROM records),
    with_span_metric AS (SELECT attributes->>'logfire.metrics'->>span_metric_name AS span_metric, * FROM with_span_metric_name),
    with_span_metric_detail AS (SELECT span_metric->>'details'->>unnest(generate_series((json_length(span_metric->>'details') - 1)::int)) AS span_metric_detail, * FROM with_span_metric)
SELECT
    span_name,
    span_metric_name,
    span_metric_detail->>'total' AS total,
    span_metric_detail->>'attributes'->>'gen_ai.token.type' AS token_type
FROM with_span_metric_detail
WHERE span_metric_name = 'gen_ai.client.token.usage'
How this query works:
- The
WITHclauses progressively expand the nested JSON in thelogfire.metricsattribute. with_span_metric_nameunnests the metric names (e.g.gen_ai.client.token.usageandoperation.cost).with_span_metricextracts the JSON object for each metric.with_span_metric_detailunnests thedetailsarray, creating a separate row for each item (one forinputand one foroutputin our example).
You can copy the WITH clauses as a reusable prefix for any query that needs to analyze aggregated metrics. The final SELECT statement then easily extracts the totals.
The result of this query will look like this, showing token counts and costs broken down by span and type:
| span_name | span_metric_name | total | token_type |
|---|---|---|---|
| span | gen_ai.client.token.usage | 224 | input |
| span | gen_ai.client.token.usage | 73 | output |
| span | operation.cost | 0.00056 | input |
| span | operation.cost | 0.00073 | output |
| agent run | gen_ai.client.token.usage | 95 | input |
| agent run | gen_ai.client.token.usage | 19 | output |
| agent run | operation.cost | 0.0002375 | input |
| agent run | operation.cost | 0.00019 | output |
| agent run | gen_ai.client.token.usage | 129 | input |
| agent run | gen_ai.client.token.usage | 54 | output |
| agent run | operation.cost | 0.0003225 | input |
| agent run | operation.cost | 0.00054 | output |